Getting bioequivalence (BE) studies right isn’t just about running clinical trials-it’s about getting the statistics right from the start. Too many generic drug developers waste months and millions because they guess their sample size instead of calculating it. A study with too few participants might miss a real difference. One with too many burns cash and exposes more people than needed to testing. The difference between success and failure often comes down to one thing: whether the power and sample size were planned properly.
Why Power and Sample Size Matter in Bioequivalence Studies
Bioequivalence studies compare a generic drug to its brand-name counterpart to prove they behave the same way in the body. The goal isn’t to show one is better-it’s to prove they’re equivalent. But equivalence isn’t obvious. You can’t just say, “They look similar.” You need hard statistical proof. Regulators like the FDA and EMA require that the 90% confidence interval for the ratio of test to reference drug (usually measured by Cmax and AUC) falls entirely within 80% to 125%. If it doesn’t, the study fails. And if your sample size is too small, even if the drugs are truly equivalent, you might still fail because the data is too noisy. This is where power comes in. Power is the chance that your study will correctly show equivalence when it’s true. A power of 80% means you have an 80% shot at passing-if everything else is right. The FDA and EMA expect at least 80% power. For drugs with narrow therapeutic windows-like warfarin or lithium-they often push for 90%. Underpowered studies are the #1 statistical reason BE trials get rejected. The FDA’s 2021 report showed that 22% of Complete Response Letters cited inadequate sample size or power calculations. That’s not a small number. It’s a warning: don’t skip the math.What Drives Sample Size in BE Studies?
You can’t pick a number out of thin air. Sample size depends on four key factors:- Within-subject coefficient of variation (CV%)-how much a person’s own drug levels bounce around from day to day. This is the biggest driver. A drug with 15% CV might need 20 people. One with 35% CV? That could require 80+.
- Expected geometric mean ratio (GMR)-how close you think the test drug’s exposure is to the reference. Most assume 1.00 (perfect match), but if the real ratio is 0.95, you need 32% more people to detect it.
- Equivalence margins-usually 80-125%, but sometimes wider for Cmax under EMA rules (75-133%). Wider margins mean smaller sample sizes.
- Study design-crossover designs (same people get both drugs) are more efficient than parallel groups (different people get each drug). Crossover studies typically need 25-50% fewer subjects.
Let’s say you’re testing a generic version of a drug with a 20% CV and expect a GMR of 0.95. With 80% power and 80-125% limits, you need about 26 subjects. But if the CV jumps to 30%, you suddenly need 52. That’s double the cost, double the time, double the risk of dropouts.
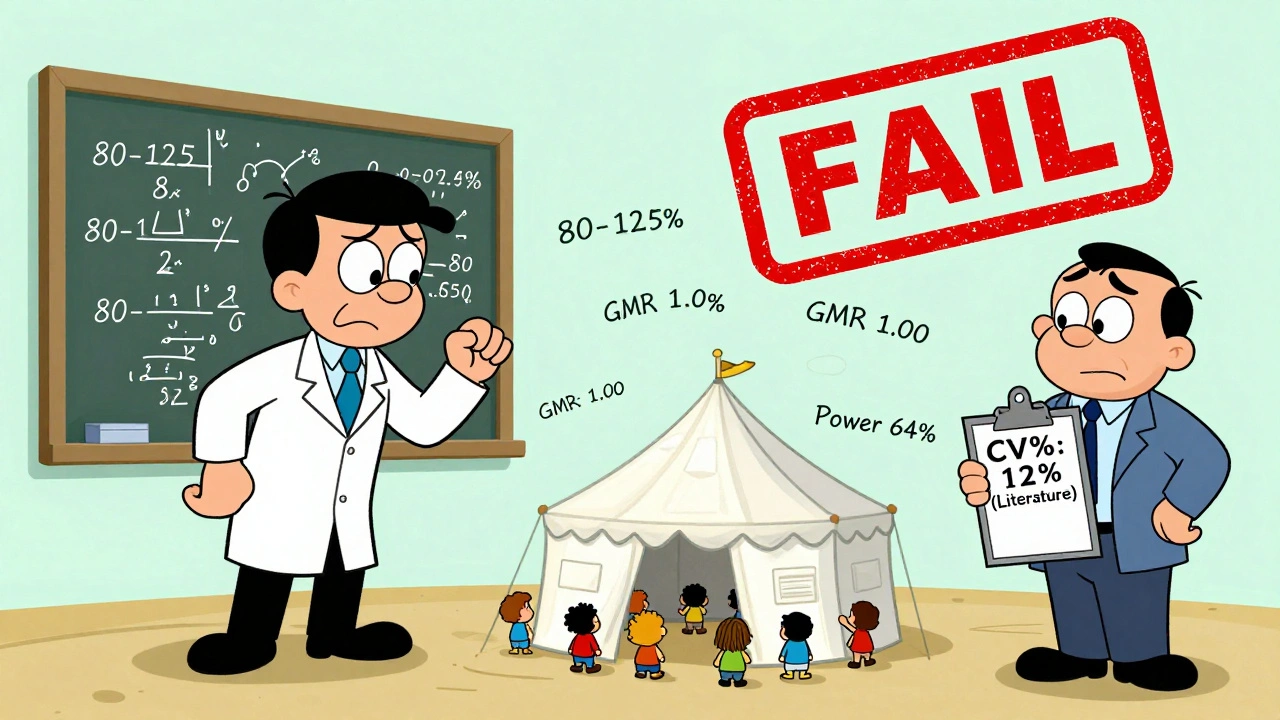
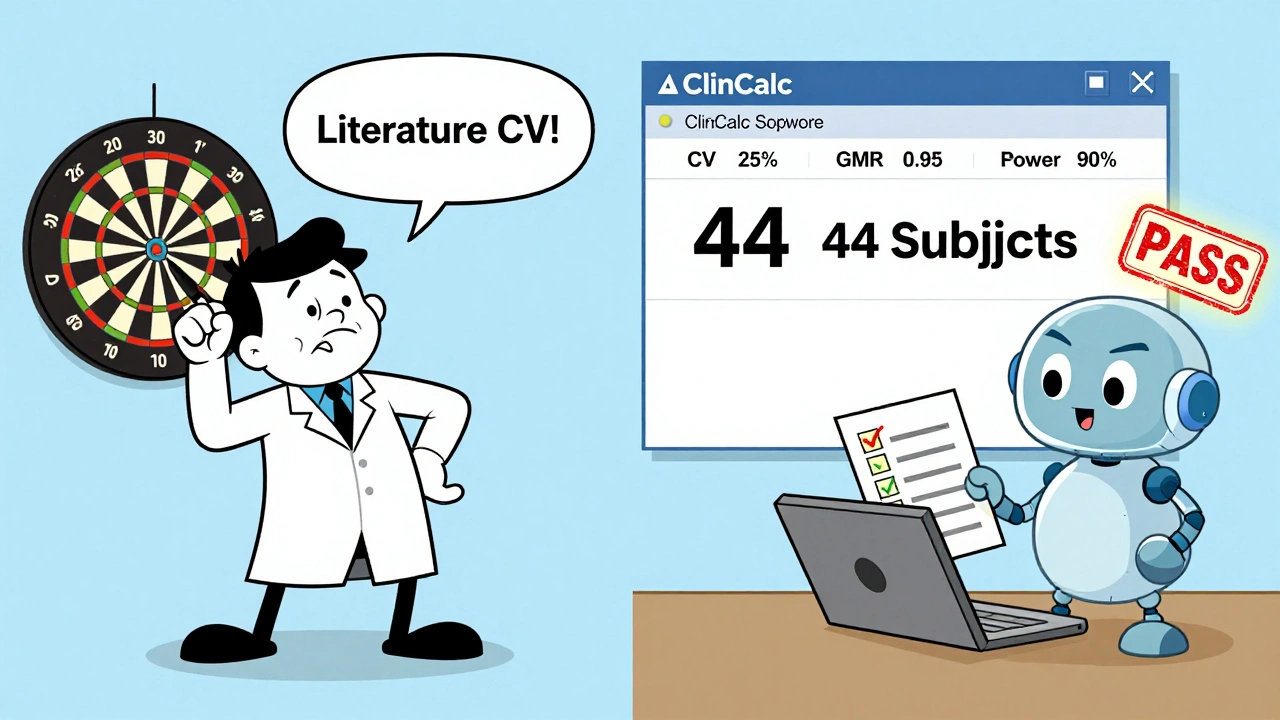
And here’s the kicker: if you use literature CV values instead of your own pilot data, you’re likely underestimating variability by 5-8 percentage points. The FDA found this happened in 63% of submissions they reviewed. That’s a recipe for failure.
How to Calculate Sample Size: The Basics
The math behind sample size in BE studies looks intimidating, but you don’t need to do it by hand. The formula is based on log-normal data and uses the within-subject standard deviation, desired power, and equivalence limits. But here’s what you actually need to know:- Start with reliable CV%. Use your own pilot study data, not published papers.
- Set your GMR conservatively. Don’t assume 1.00. Use 0.95-1.05 based on early data.
- Decide on power: 80% for most drugs, 90% for narrow therapeutic index drugs.
- Use a validated calculator. Don’t rely on generic power tools-use ones built for BE.
Popular tools include:
- ClinCalc BE Sample Size Calculator-free, web-based, FDA-aligned
- PASS-industry standard, supports RSABE and adaptive designs
- FARTSSIE-free, open-source, great for crossover designs
- nQuery-used by big pharma, expensive but comprehensive
For example: with a 25% CV, GMR of 0.95, 90% power, and 80-125% limits, ClinCalc gives you 44 subjects. Add 10-15% for dropouts? That’s 50-51. Done. No guesswork.
Highly Variable Drugs: The RSABE Exception
Some drugs-like clopidogrel or valproic acid-are naturally all over the place in the body. Their CV% can exceed 30%. If you tried to use standard BE rules, you’d need 100+ subjects. That’s often impossible. That’s where Reference-Scaled Average Bioequivalence (RSABE) comes in. Instead of fixed 80-125% limits, the margins widen as variability increases. The FDA allows this for drugs with CV% > 30%. With RSABE, a drug with 45% CV might only need 24-30 subjects instead of 120. But RSABE isn’t a loophole. It’s a rule. You must prove your drug is highly variable first. And you still need to meet the 90% CI requirement under the scaled limits. The EMA has similar rules but different thresholds. Global sponsors need to plan for both.What Happens When You Get It Wrong?
Underestimating variability is the most common mistake. One oncology generic sponsor assumed a 12% CV based on literature. Their pilot showed 31%. They ran a 24-subject study. Failed. Lost $1.2 million. Had to restart. Another company assumed a perfect 1.00 GMR. Their actual ratio was 0.93. Their power dropped from 90% to 67%. The study failed. The FDA flagged it for “inadequate statistical justification.” And then there’s the dropout problem. You calculate 30 subjects. You enroll 30. Five drop out. Now you have 25. Power drops to 72%. You’re below the 80% threshold. You didn’t account for reality. The fix? Always add 10-15% to your calculated sample size. If you need 28, enroll 32. If you need 50, enroll 58. It’s cheap insurance.Joint Power for Cmax and AUC
Most people calculate power only for the more variable parameter-usually Cmax. But you need to pass both Cmax and AUC. If each has 80% power independently, the chance of passing both is 80% × 80% = 64%. That’s not enough. The American Statistical Association recommends calculating joint power-the chance that both endpoints pass. This requires more subjects. A 2022 survey found only 45% of sponsors do this. That’s why so many studies fail on one endpoint after passing the other. Best practice: calculate power for both, then use the higher sample size. If Cmax needs 40 and AUC needs 35, plan for 40. Don’t gamble.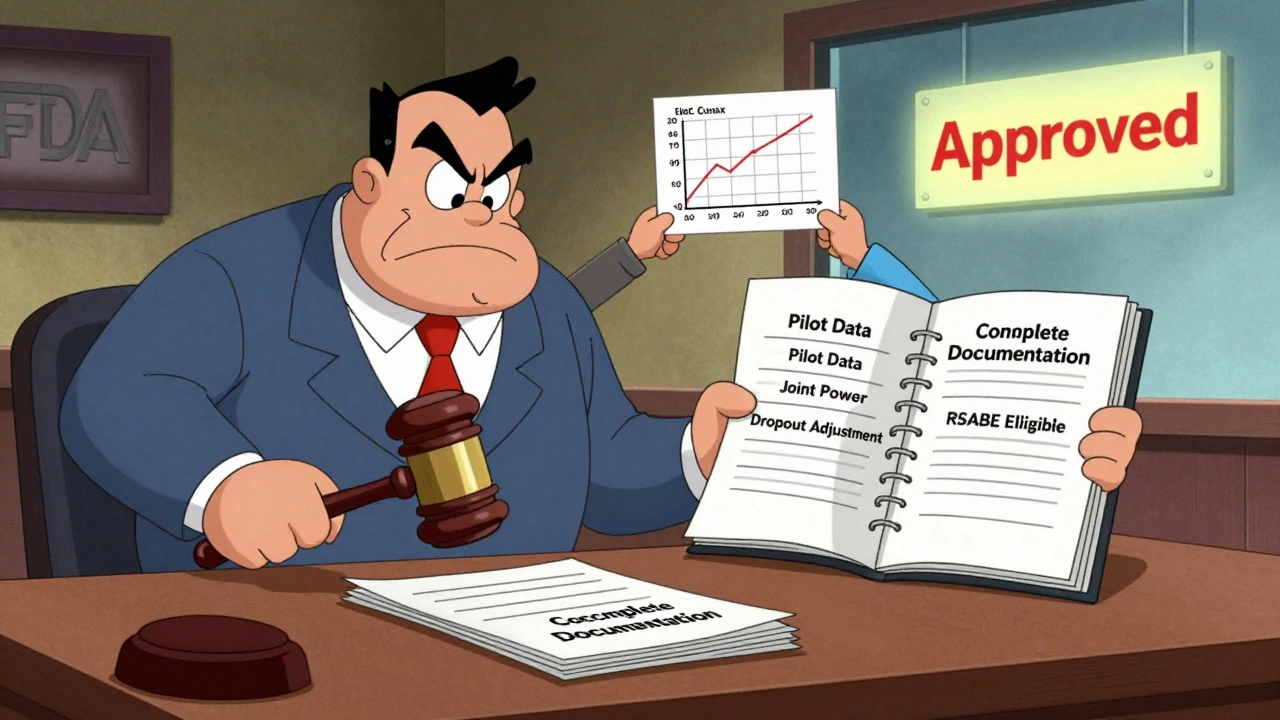
Documentation: The Regulatory Trap
You might do everything right-but if you can’t prove it, you still fail. The FDA’s 2022 review found that 18% of statistical deficiencies were due to incomplete documentation. Your sample size justification must include:- Software name and version used
- Exact input values (CV%, GMR, power, margins)
- Source of CV% (pilot study ID, reference)
- Reason for GMR assumption
- Dropout adjustment
- Whether joint power was considered
Don’t just say “we used PASS.” Show the inputs. Show the output. Show the logic. Regulators don’t trust assumptions. They trust paper trails.
What’s Changing in 2025?
The field is moving. Model-informed bioequivalence (MIBE) is emerging-using pharmacokinetic modeling to predict equivalence with fewer subjects. The FDA supports it. But as of 2023, only 5% of submissions use it. Regulatory uncertainty keeps most sponsors away. Adaptive designs are also gaining traction. These let you re-estimate sample size halfway through the study based on real data. The FDA’s 2023 draft guidance now allows this-but only if you pre-specify the rules. No post-hoc tweaks. The bottom line: the rules aren’t getting easier. They’re getting stricter. Transparency is now mandatory. Guessing is no longer an option.Practical Checklist for Your Next BE Study
Before you enroll a single subject, run through this:- ✅ Get CV% from your own pilot study, not literature
- ✅ Assume GMR = 0.95, not 1.00
- ✅ Use 90% power for narrow therapeutic index drugs
- ✅ Use a BE-specific calculator (ClinCalc, PASS, FARTSSIE)
- ✅ Calculate joint power for Cmax and AUC
- ✅ Add 10-15% for dropouts
- ✅ Document every number, every assumption, every tool
- ✅ If CV% > 30%, evaluate RSABE eligibility
There’s no shortcut. But if you follow this, you won’t be one of the 22% whose study gets rejected for statistical reasons.
What happens if my BE study has low power?
A low-power study (below 80%) has a high risk of failing even if the drugs are truly equivalent. This is called a Type II error. Regulators will reject the submission, and you’ll need to repeat the entire trial-costing months and hundreds of thousands of dollars. Always aim for at least 80% power, and 90% for narrow therapeutic index drugs.
Can I use a sample size from a similar drug in the literature?
No. Literature values often underestimate true within-subject variability by 5-8%. The FDA found this in 63% of submissions. Always base your sample size on your own pilot data. If you don’t have pilot data, run a small pilot study before the main trial.
Why do some BE studies need over 100 subjects?
Highly variable drugs (CV% > 40%) require large sample sizes under standard BE rules because the data is too noisy to detect equivalence with small groups. Without using RSABE, you might need 100+ subjects. That’s why RSABE was developed-it allows wider equivalence margins for these drugs, reducing sample size to 24-48.
Is 80% power enough, or should I always use 90%?
80% is the regulatory minimum and acceptable for most drugs. But for narrow therapeutic index drugs (like digoxin, lithium, or cyclosporine), the FDA expects 90% power. Using 90% gives you a safety buffer and reduces the chance of a costly failure. It’s not required for all drugs-but it’s smart.
Do I need to account for both Cmax and AUC in my power calculation?
Yes. Each endpoint must meet the 80-125% criterion independently. If you calculate power only for Cmax (say, 80%), and AUC has 80% power too, your chance of passing both is only 64%. Always calculate joint power and use the higher sample size required by either endpoint.
What’s the biggest mistake people make in BE sample size planning?
Assuming a perfect 1.00 geometric mean ratio (GMR). In reality, even well-formulated generics have a ratio around 0.95-1.05. Assuming 1.00 can reduce your actual power by 30% or more. Always use a conservative GMR based on early data, not idealized assumptions.
Can I adjust sample size after starting the study?
Only if you pre-specified an adaptive design in your protocol and got regulatory approval. Post-hoc sample size adjustments are not allowed. The FDA’s 2023 draft guidance permits adaptive designs, but only with strict pre-planned rules. Don’t improvise.
Comments (15)
matthew dendle
10 Dec, 2025lol so you're telling me we spent 6 months and $2M because someone thought 1.00 GMR was a good guess? classic. just use ClinCalc and stop winging it. the FDA ain't your buddy.
Jim Irish
10 Dec, 2025This is one of the clearest summaries of BE power calculations I've seen. Thank you for emphasizing pilot data over literature. Too many teams cut corners and wonder why they get rejected.
Kristi Pope
12 Dec, 2025I love how this breaks it down like a recipe - CV%, GMR, power, dropout buffer. It’s not magic, it’s math. And honestly? Adding that 10-15% feels like putting a seatbelt on your budget. Smart, simple, survivable.
Eddie Bennett
13 Dec, 2025I’ve seen this play out twice. First time: team used lit CV, failed. Second time: they did a pilot, added 15%, passed. The difference wasn’t the drug - it was the humility to do the math.
Jack Appleby
14 Dec, 2025Anyone who uses FARTSSIE without understanding the underlying log-normal distribution is playing Russian roulette with their NDA. The FDA doesn’t care if your tool is free - they care if your assumptions are defensible. This isn’t Excel modeling - it’s regulatory science.
Frank Nouwens
15 Dec, 2025Thank you for the practical checklist. I’ve shared this with our entire development team. Clarity like this saves time, money, and stress. Well done.
Aileen Ferris
15 Dec, 2025nah bro rsabe is just a loophole for lazy pharma. if your drug's that variable maybe it shouldn't be a generic. also who uses pass? that thing costs more than my car
Michelle Edwards
16 Dec, 2025You’re right about joint power - I used to ignore it until my AUC failed after Cmax passed. Now I always plan for the worst case. It’s not scary, it’s just smarter.
Sarah Clifford
18 Dec, 2025so like... if i just enroll 100 people it'll be fine right? why do we even need math?
Regan Mears
18 Dec, 2025The dropout buffer isn’t optional - it’s survival. I had a study where 3 people dropped out and we went from 92% power to 78%. We had to scramble. Always plan for chaos. Always.
Ben Greening
19 Dec, 2025The documentation requirements are non-negotiable. I once saw a submission rejected because the version number of PASS was omitted. It was not a joke.
David Palmer
19 Dec, 2025this whole thing feels like overkill. just make the drug work. why do we need 50 people for a pill? i mean really
Vivian Amadi
20 Dec, 2025I’ve been doing this for 15 years and I still see people use literature CVs. It’s not ignorance - it’s laziness. And it’s costing companies millions. Someone needs to fire the people who do this.
Jimmy Kärnfeldt
21 Dec, 2025There’s something beautiful about turning fear into a formula. Power isn’t about being right - it’s about being prepared. The math doesn’t care if you’re nervous. It just gives you the numbers. And sometimes, that’s all you need.
Jean Claude de La Ronde
21 Dec, 2025so you're telling me the FDA is basically saying 'do the math or go home'? and we're shocked? lol. we've been doing this since the 80s. the real problem? people still think 'it'll probably work'.